Histology Techniques - Cell changes to Cancer
- Cellular Injury
- Cell Changes
- Apoptosis
- Necrosis
- Inflammation
- Metaplasia
- Atrophy
Cellular injury occurs when the limits of the cells adaptive response to a stimulus are exceeded. There are several causes as shown on the table below.
Table – Causes of cellular injury and why
|
Cause |
|
Oxygen Deprivation eg Ischemia, myocardial infarction, CO poisoning |
|
Physical Agents eg Trauma, excessive heat/cold, electrical damage, Radiation |
|
Chemical damage eg Narcotics, alcohol, Environmental pollution |
|
Infectious agents eg Viruses, bacteria, fungi, parasites |
|
Autoimmune conditions eg SLE |
|
Genetic mutations eg Down syndrome, cystic fibrosis |
|
Nutrition imbalance eg B12 deficiency |
The effects on cells leading to cellular injury can be separated into reversible damage, where the cell is able to recover if the cause is removed or it is not strong enough to cause significant damage, with normally only an acute response to the injury eg splint in finger, which is removed, allowing the tissue and cells to revert back to normal.
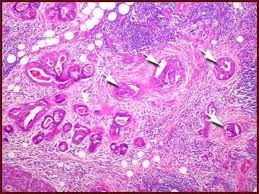
While irreversible cellular damage is where the cell is unable to recover from the damage inflicted and will eventually die, for example a tuberculosis infection, where the immune response is unable to reach the TB bacteria.
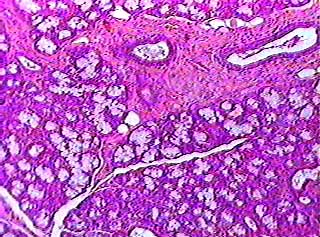
Picture 1 – x 40 chronic inflammations due to Tuberculosis
This starts out with acute inflammation with neutrophil involvement but eventually over time it becomes chronic with lymphocyte involvement due to the long term nature of the cell injury.
Cell changes can occur, when the cell encounters adverse environmental changes for example deprivation of oxygen or viral infection.
Some of the adaptive responses include the production of oxidative stress response proteins, which can be activated in response to lack of oxygen as well as enzyme activity being modified, by temporarily removing toxins. Also another adaptive response to oxygen deprivation is that only the glycolysis pathway is used to provide energy under anaerobic conditions, leading to a lactic acid build up. These responses are only temporary as if sustained this will lead to cell death due to lack of ATP. Another adaptive response that can be used by cells is the use of heat shock proteins. These are used for more than just heat response and are activated in most circumstances to assist damaged cells, by increasing protein synthesis and repairing damaged or denatured proteins. Other responses to cell changes, include the release of inflammatory proteins like interleukins for example in response to foreign antigens being detected eg from bacteria like Helicobacter pylori. This can then build up to lead up to an inflammatory response as shown below, which can be either acute or if long term chronic.
Picture 2 – Inflammation in heart tissue x20
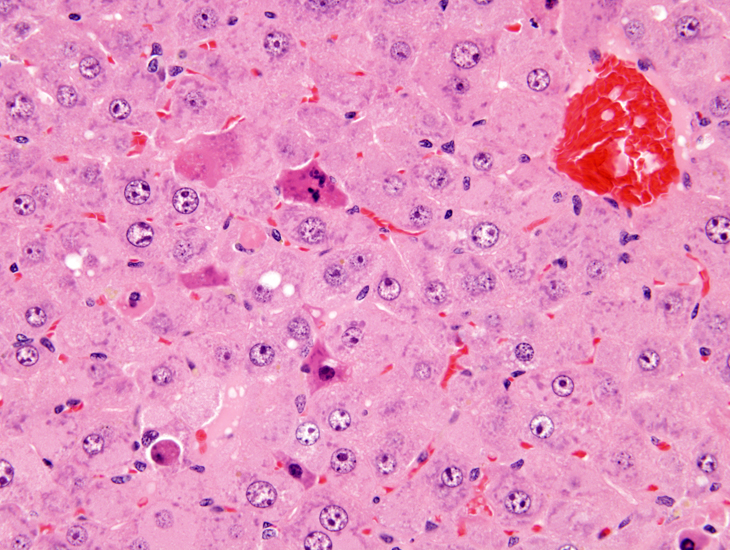
Apoptosis is programmed cell death which occurs when the cell dies due to the activation of the regulated internal program. This process is used normally to remove unwanted cells from tissue with minimal disruption to the surrounding tissue. This is one of the mechanisms used to regulate cell and tissue growth, with disruption to this process sometimes leading to the formation of tumours.
In the normal process of apoptosis in the body, phagocytes are used to target cells that have had their cell membranes altered to become a target as they are no longer required or have become defective in some way, for example if infected by a virus. The cell contents are not lost so no immune reaction occurs in this process. However a pathological version of apoptosis exists, where conditions like hepatitis or damage due to certain drugs disrupting the DNA repair process can also produce apoptosis of the cell. This version is not under normal cellular control and can be damaging if widespread as it will trigger an immune reaction.
Picture 3 – x40 Apoptosis in liver
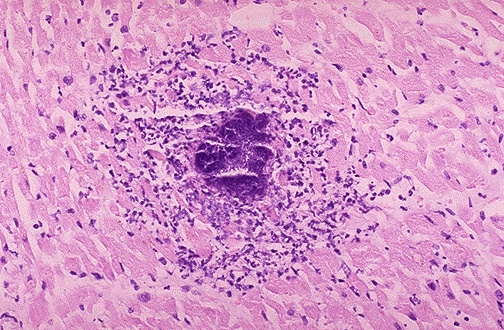
Necrosis is where the cell suffers an injury so severe that it results in unprogrammed cell death. Unlike apoptosis, when necrosis occurs the cells death leads to the release of cellular products, as shown in the diagram below.
Diagram 1 – Necrosis v apoptosis
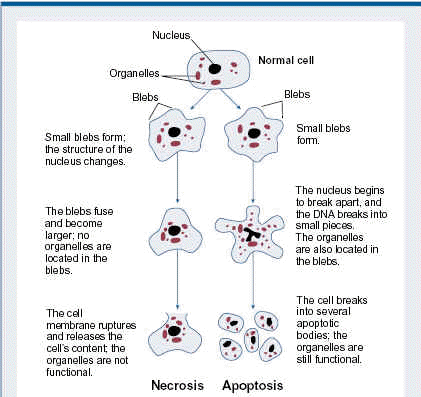
As a result, an inflammatory response is triggered in the surrounding tissue. Depending on the length of this process the inflammation which originally might have been acute can become chronic over time if the trigger is not removed or eliminated eg Hepatitis in the liver.
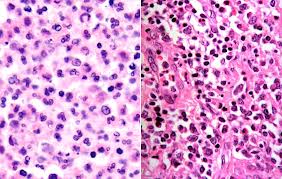
The differences between the two processes are shown in the photo below.
Photo 1 – Acute v chronic inflammation
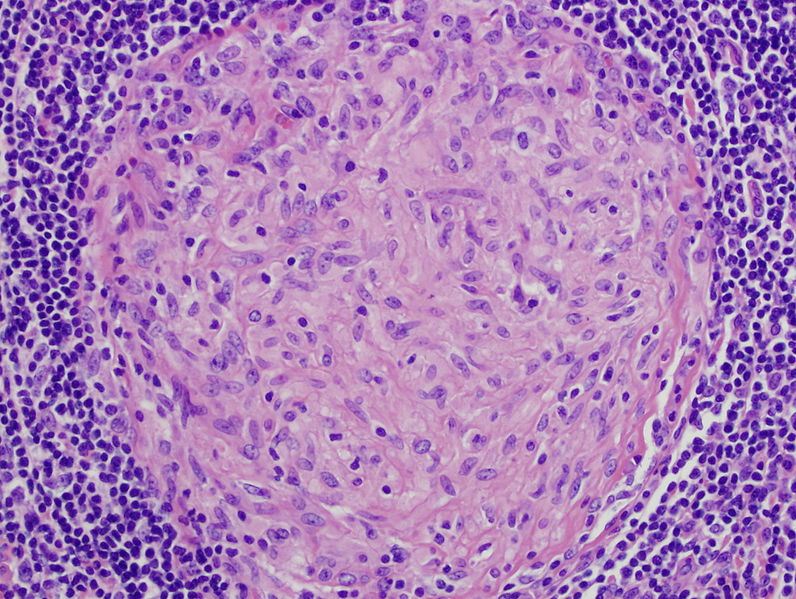
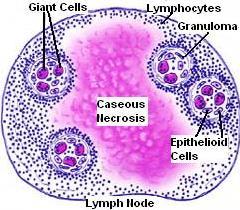
Necrosis can be seen below in the tissue in the area around the site of injury to the tissue, in this case due to tuberculosis in the lymph node as can be seen in the diagram and picture below.
Diagram 2 – Process of necrosis in Lymph node in response to Tuberculosis
This is the reversible replacement of one mature differentiated cell type by another that is abnormal in this site. There are many examples of metaplasia in the body, including the common Barrets oesophagus as can be seen below. There are several differences between normal and metaplastic oesophageal histology.
Picture 5 – Normal Oesophageal Histology x40
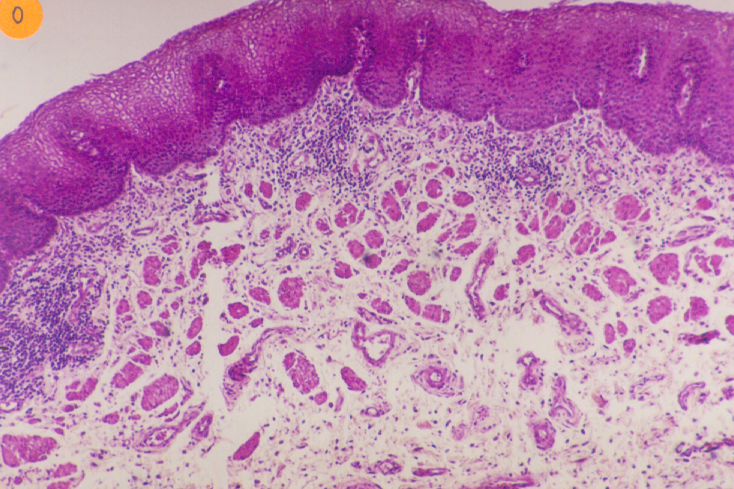
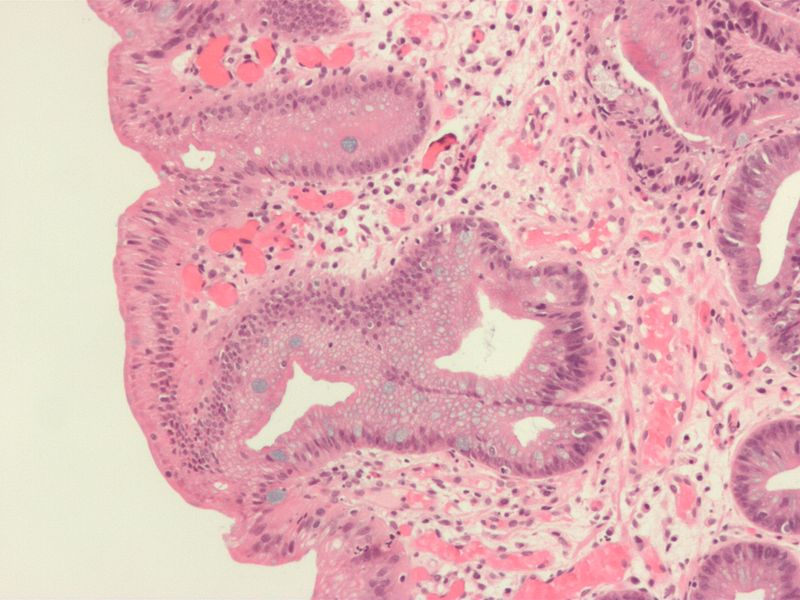
The oesophagus can undergo specific type of metaplastic change called Barrets oesophagus. The trigger for this change is thought to be exposure to gastric acid juices but it not known for certain. As you can see the cells have changed from stratified squamous epithelium to columnar epithelium.
Picture 6 – Abnormal oesophagus histology –Barrets oesophagus x40
The definition of atrophy is when the cell shrinks in size and number. This can occur, for example when a cell is deprived of water, it will shrink in size. It can also result from a lack of normal stimulus or chronic inflammation as well. This is also part of the normal development of some tissues eg Thymus will decrease in size after puberty. The difference between normal and atrophied tissue can be seen in the salivary tissue photographs below.
Picture 7 – Normal Salivary gland
Picture 8 – Atrophied salivary gland x10 H&E